2018.06.15
JPO Status Report 2018 (Extract)
Examinations
|
|
First Action Pendency
|
Accelerated Examination
|
Total Pendency
|
| Patent |
9.4 months
|
2.3 months
|
14.6 months
|
| Design |
6.1 months
|
1.9 months
|
7.0 months
|
| Trademark |
4.9 months
|
1.8 months
|
6.8 months
|
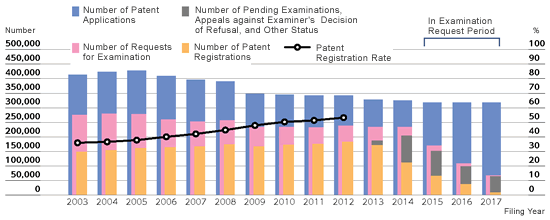
Number of Patent Registrations, etc. by Filing Year
|
2003
|
2004
|
2005
|
2006
|
2007
|
2008
|
2009
|
2010
|
|
| Number of Patent Applications |
413,008
|
423,017
|
426,974
|
408,569
|
396,160
|
390,879
|
348,429
|
344,397
|
| Number of Requests for Examination |
274,752
|
280,250
|
277,797
|
260,221
|
252,485
|
257,116
|
233,901
|
233,780
|
| Number of Patent Registrations |
148,587
|
154,942
|
161,363
|
163,773
|
166,612
|
174,824
|
166,916
|
173,298
|
|
2011
|
2012
|
2013
|
2014
|
2015
|
2016
|
2017
|
|
| Number of Patent Applications |
342,312
|
342,589
|
328,138
|
325,688
|
318,345
|
317,922
|
318,028
|
| Number of Requests for Examination |
232,471
|
237,906
|
233,708
|
233,963
|
169,285
|
108,391
|
67,010
|
| Number of Patent Registrations |
175,818
|
182,416
|
171,077
|
111,645
|
65,761
|
37,977
|
8,831
|
Notes:
– The number of patent registrations, etc. by filing year does not include the number of applications for registration of extension of the duration of a right.
– The number of patent registrations by filing year is a provisional figure as of March 6, 2018.
– The numbers of requests for examination by filing year in applications from 2015 to 2017 are provisional figures as of March 6, 2018.
Top 10 Companies with the Most Number of Patent Registrations in 2017
|
Rank in 2016
|
Rank in 2017
|
Applicant
|
Number of Registrations
|
|
| (3) | 1 | Mitsubishi Electric Corporation |
4,484 (4,042)
|
|
| (1) | 2 | Canon Inc. |
3,931 (4,095)
|
|
| (4) | 3 | TOYOTA MOTOR CORPORATION |
3,378 (3,717)
|
|
| (2) | 4 | Panasonic Intellectual Property Management Co., Ltd. |
2,990 (4,046)
|
|
| (8) | 5 | Honda Motor Co., Ltd. |
2,502 (2,144)
|
|
| (9) | 6 | Ricoh Company, Ltd. |
2,468 (2,142)
|
|
| (5) | 7 | FUJITSU LIMITED |
2,431 (2,399)
|
|
| (6) | 8 | DENSO CORPORATION |
2,110 (2,374)
|
|
| (7) | 9 | SEIKO EPSON CORPORATION |
1,971 (2,281)
|
|
| (11) | 10 | TOSHIBA CORPORATION |
1,753 (1,647)
|
|
Notes:
– Numbers in parentheses are for 2016.
– Each applicant was counted in the case joint applicants filed.
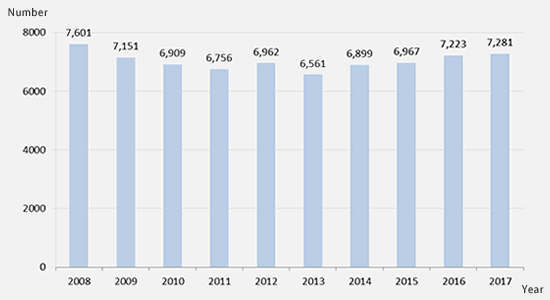
Number of Patent Applications Filed by Universities, etc., in Japan.
Notes:
– Applications by filed a university president, university, or approved TLO were counted.
– The count includes joint applications with corporations, etc.
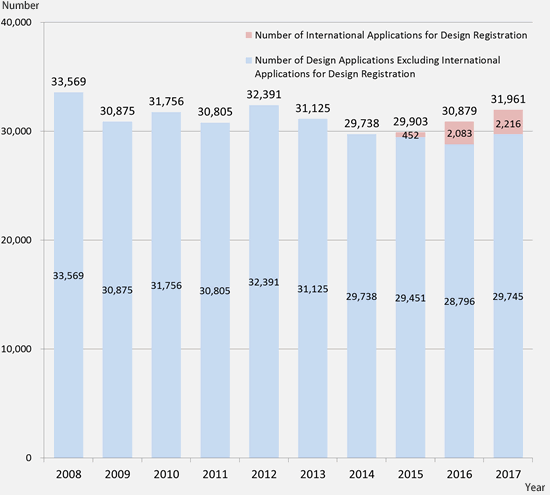
Number of Design Applications
Notes:
– The number of international applications for design registration is the number of international applications under the Geneva Act of the Hague Agreement concerning the International Registration of Industrial Designs (the Geneva Act) that designate Japan as a designated contracting party and that has been published by the International Bureau. The number of applications was counted by the international publication date.
– The JPO began to process international applications filed under to the Geneva Act on May 13, 2015.
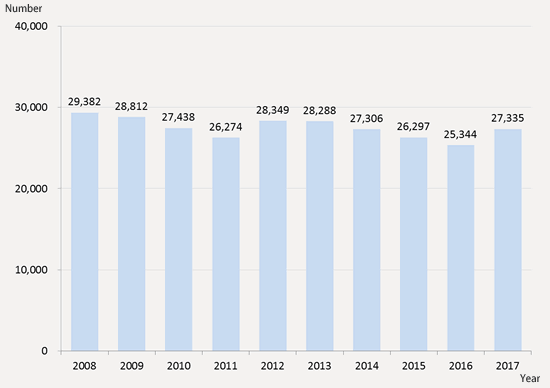
Number of Design Registrations
Companies with the Most Number of Design Registrations in 2017
|
Rank in 2016
|
Rank in 2017
|
Applicant
|
Number of Registrations
|
|
| (2) | 1 | Mitsubishi Electric Corporation |
429 (415)
|
|
| (1) | 2 | Panasonic Intellectual Property Management Co., Ltd. |
413 (430)
|
|
| (3) | 3 | Okamura Corporation |
360 (335)
|
|
| (117) | 4 | Dyson technology Ltd. |
231 (34)
|
|
| (6) | 5 | Sharp Corporation |
201 (215)
|
|
| (37) | 6 | Nippon Steel & Sumitomo Metal Corporation |
199 (70)
|
|
| (4) | 7 | LIXIL Corporation |
167 (316)
|
|
| (5) | 8 | Honda Motor Co., Ltd. |
156 (233)
|
|
| (10) | 9 | Dai Nippon Printing Co., Ltd. |
132 (141)
|
|
| (11) | 10 | FP Corporation |
131 (133)
|
|
Notes:
– The numbers in parentheses are for 2016.
– In the case joint applicants filed, each applicant was counted.
Number of Trademark Applications
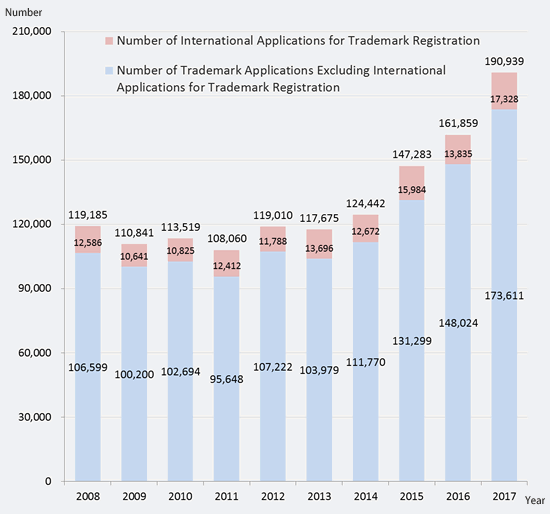
Notes:
– The number of trademark applications includes applications for defensive mark registration and applications for renewal based on defensive mark registration.
– The number of international applications for trademark registration is the number of international applications under the Protocol Relating to the Madrid Agreement which designate Japan and for which their designated states were noticed to the JPO. The number of the applications were counted by the date of the notification.
Number of Trademark Registrations
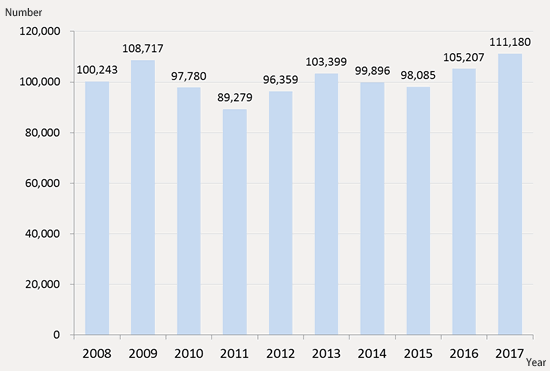
Notes:
– The numbers of trademark registrations includes applications for renewal
Top 10 Companies with the Most Number of Trademark Registrations in 2017
|
Rank in 2016
|
Rank in 2017
|
Applicant
|
Number of Registrations
|
|
| (1) | 1 | Sanrio Company, Ltd |
553 (939)
|
|
| (2) | 2 | Shiseido Company, Limited |
497 (539)
|
|
| (4) | 3 | Kao Corporation |
326 (330)
|
|
| (9) | 4 | Kobayashi Pharmaceutical Co., Ltd. |
212 (181)
|
|
| (7) | 5 | Meiji Co., Ltd |
202 (206)
|
|
| (3) | 6 | KOSE Corporation |
201 (331)
|
|
| (10) | 7 | Panasonic Corporation |
194 (173)
|
|
| (5) | 8 | FUJITSU LIMITED |
183 (309)
|
|
| (28) | 9 | NTT DOCOMO, INC. |
179 (101)
|
|
| (8) | 10 | MORINAGA MILK INDUSTRY CO., LTD. |
169 (197)
|
|
Notes:
– The numbers in parentheses are for 2016.
– In the case joint applicants filed, each applicant was counted
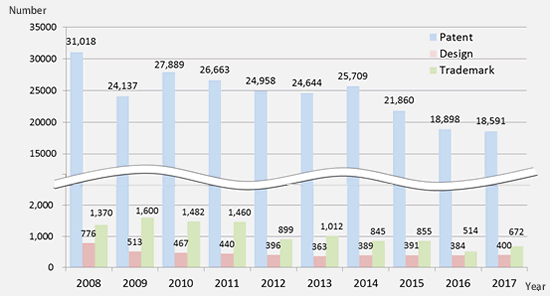
Number of Requests for Appeal against an Examiner’s Decision of Refusal
Number of Requests for Trial for Invalidation
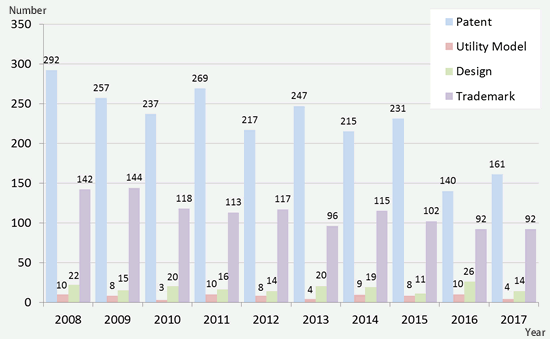
Number of Oppositions (based on the number of rights opposed)
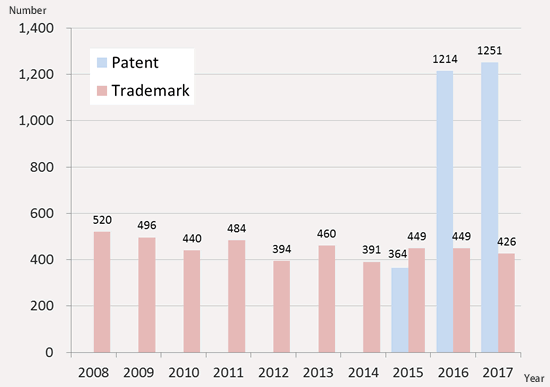
Notes:
The system of opposition to grant of patent entered into force on April 1, 2015.
Number of Revocation Actions against Trial/Appeal Decisions in 2017
|
|
Patent and Utility Model
|
Design
|
Trademark
|
| Ex-parte appeal |
46 (77)
|
4 (22)
|
15 (11)
|
| Inter-partes trial |
110 (115)
|
4 (4)
|
45 (39)
|
| Opposition |
11 (3)
|
|
2 (8)
|
Notes:
The numbers in parentheses are for 2016.
1 This includes appeals against examiner’s decision of refusal, and appeals against examiner’s decision to dismiss amendments.
2 This includes trials for invalidation, trials for rescission, and trials for correction.
Number of Court Decisions in Revocation Actions against Trial/Appeal Decisions in 2017
|
|
Patent and Utility Model
|
Design
|
Trademark
|
|||
|
Dismissal of Action
|
Revocation of Decision
|
Dismissal
of Action |
Revocation
of Decision |
Dismissal
of Action |
Revocation
of Decision |
|
| Ex-parte appeal |
42 (48)
|
8 (11)
|
4 (1)
|
4 (13)
|
10 (12)
|
1 (3)
|
| Inter-partes trial |
58 (54)
|
36 (23)
|
3 (3)
|
0 (0)
|
27 (23)
|
10 (9)
|
| Opposition |
1 (0)
|
2 (0)
|
|
|
0 (5)
|
0 (0)
|
Notes:
The numbers in parentheses are for 2016.
1 This includes appeals against examiner’s decision of refusal, and appeals against examiner’s decision to dismiss amendments.
2 This includes trialsfor invalidation, trials for rescission, and trials for correction.